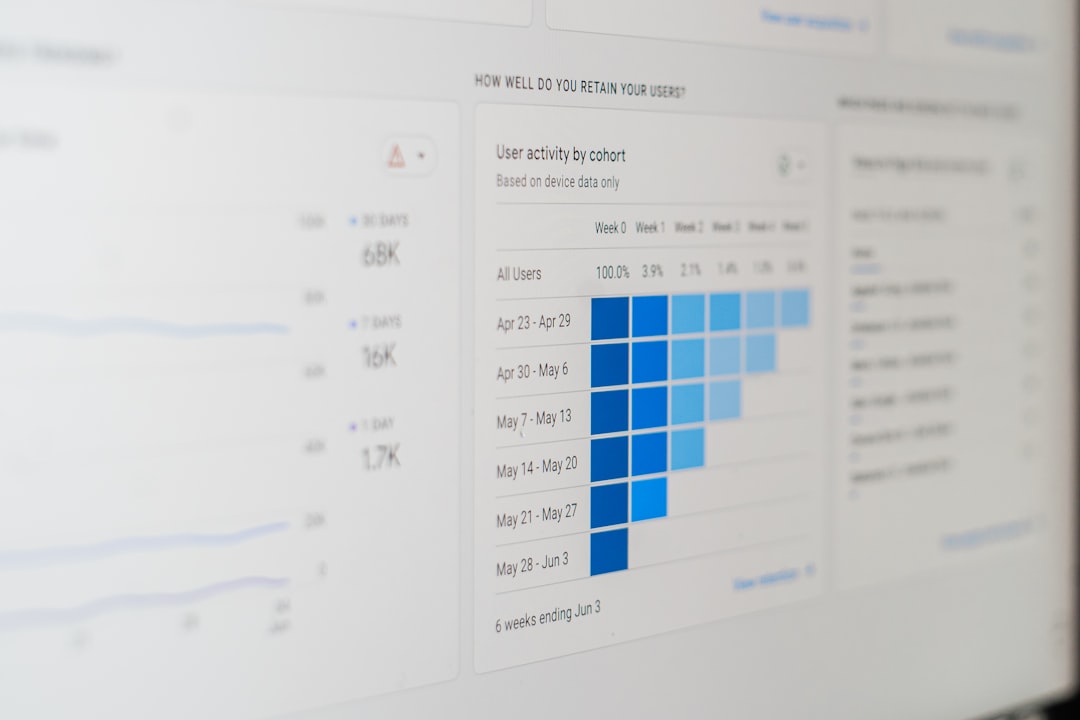
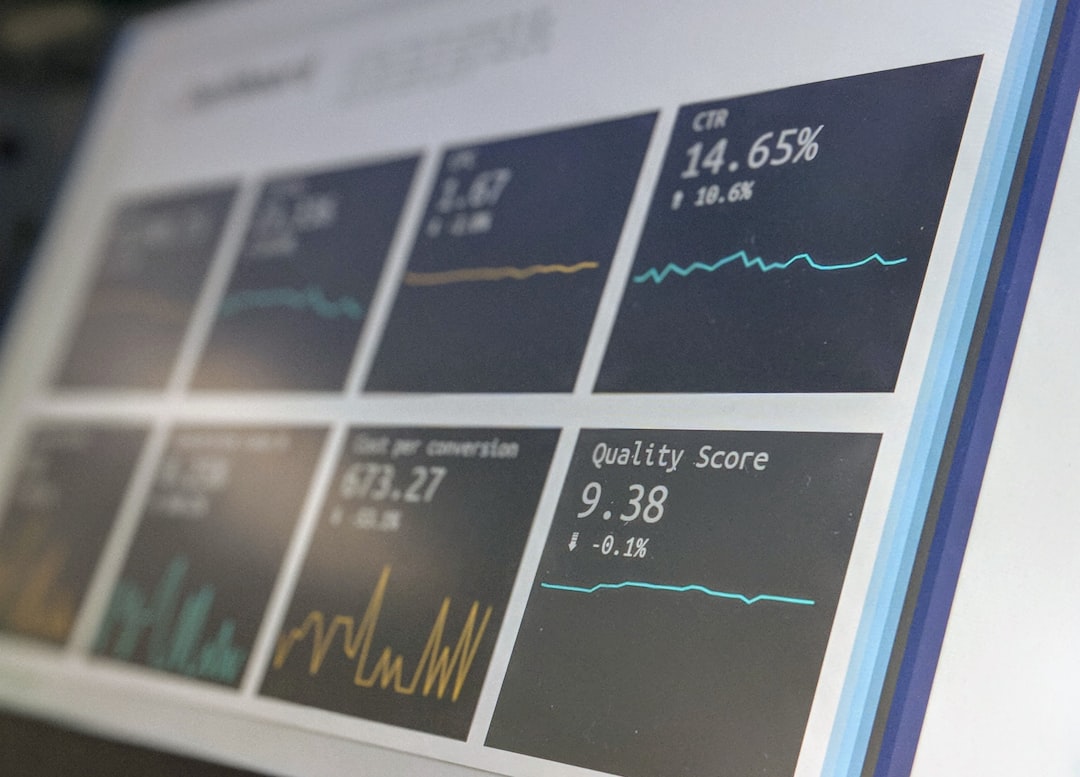
In the fast-evolving world of digital products, data has become the beating heart that drives product decisions. Product analytics allows teams to understand user behavior, measure feature performance, and optimize overall user experience. However, as product teams become increasingly data-driven, it’s easy to fall into traps that lead to misleading insights and poor decisions. These traps, known as product analytics anti-patterns, can derail even the most advanced analytics initiatives.
What Are Product Analytics Anti-Patterns?
Anti-patterns are common responses to recurring problems that are counterproductive or ineffective. In the context of product analytics, they represent poor practices or flawed strategies that may seem logical on the surface but ultimately lead to confusion, misalignment, or failure to capture real value from data.
Recognizing and avoiding these anti-patterns is essential for building a strong foundation for data-informed decision-making. Below are the key product analytics anti-patterns organizations should watch out for.
1. Tracking Everything Without a Strategy
One of the most common mistakes product teams make is trying to track every single event in their applications. This might feel comprehensive, but it often results in information overload, unclear KPIs, and data clutter that hinders actionable insights.

Why It’s Harmful: Collecting data without a clear objective overwhelms analytics platforms, increases storage costs, and makes querying data slower and more difficult. More importantly, it dilutes focus on key business metrics and increases the risk of drawing the wrong conclusions.
What to Do Instead: Develop a clear analytics strategy that ties data tracking to business goals. Define a product analytics plan, outline key user journeys, and identify a limited set of meaningful events that align with your objectives.
2. Misaligned Metrics Between Teams
In companies with multiple teams, it’s common to find each team using different metrics or definitions of the same metric. For example, what “active user” means to the product team might differ from how marketing defines it.
Why It’s Harmful: When metrics are misaligned, teams operate based on different assumptions, leading to miscommunication, conflicting priorities, and inconsistent reporting.
What to Do Instead: Standardize core metrics across the organization. Establish well-defined, accessible metric documentation and ensure alignment on KPIs in cross-functional meetings. A shared data dictionary can go a long way in promoting clarity.
3. Ignoring Qualitative Data
Product analytics often emphasizes quantitative data like page views, conversion rates, or bounce rates. While these numbers provide valuable behavioral insights, they don’t tell the full story of “why” users behave the way they do.
Why It’s Harmful: Relying solely on numbers can mask important context. For instance, a drop in user engagement may be misattributed to a UI change, when in fact user interviews might reveal a deeper issue in perceived value.

What to Do Instead: Incorporate qualitative data from user interviews, surveys, customer support tickets, and usability tests. Triangulating qualitative and quantitative data leads to more informed and empathetic product decisions.
4. Over-Optimizing for Short-Term Wins
Analytics often reveal immediate opportunities to boost conversions or engagement — like optimizing a CTA button or shortening a funnel. While these improvements are valuable, they can distract from strategic, long-term product thinking.
Why It’s Harmful: Constant optimization of micro-metrics can create a “local maximum” problem, where short-term metrics improve at the expense of long-term user satisfaction and retention.
What to Do Instead: Balance iterative optimization with broader product vision. Align analytics with long-term KPIs like customer lifetime value (CLV), feature adoption trends, or product-market fit indicators. Keep an eye on both leading and lagging indicators.
5. Blindly Trusting Tools
No analytics tool is perfect. Data collection methods can have bugs, SDKs can break, and instrumentation can be inconsistent across platforms. Trusting dashboards without verifying data integrity is a dangerous habit.
Why It’s Harmful: Decisions made on inaccurate data can lead to wasted product cycles, wrong prioritizations, or flawed experiments.
What to Do Instead: Implement regular auditing of data collection. Use event validation tools, test tracking on staging environments, and embed analytics QA processes into the development cycle.
6. Lack of Event Naming Conventions
Event names like “button_click” or “feature_used” are vague and prevent meaningful analysis at scale, especially across teams and over time.
Why It’s Harmful: Inconsistent naming conventions cause disorganized dashboards, difficult queries, and chronic misinterpretation of event data.
What to Do Instead: Define a consistent and scalable event naming schema. Use clear, descriptive verbs and objects (e.g., “nav_signup_button_clicked”). Document each event’s properties and purpose in a shared event taxonomy.
7. Over-Reliance on Vanity Metrics
Metrics like total number of sessions, downloads, or users can be impressive but don’t necessarily reflect the health or usefulness of a product.
Why It’s Harmful: These metrics can lead teams to chase growth at the expense of retention or user satisfaction. You might grow rapidly but fail to build a sustainable product.
What to Do Instead: Focus on actionable metrics that align with real user value, such as user activation rates, retention cohorts, and repeated feature usage. These will give a more accurate picture of product-market fit and long-term success.

8. Siloed Analytics Ownership
In some organizations, analytics is owned by a single team — either product, data science, or engineering — without involving stakeholders across departments.
Why It’s Harmful: Siloed ownership limits understanding, creates bottlenecks, and slows down insights. Teams closer to the customer might not have access to the data they need.
What to Do Instead: Empower a cross-functional analytics culture. Train product managers, designers, and marketers in self-serve analytics tools. Maintain shared dashboards, encourage experimentation, and celebrate data wins across teams.
Conclusion
Product analytics can be a transformative force for teams — but only when used thoughtfully. By avoiding these anti-patterns, organizations can unlock the full potential of their data, make smarter decisions, and build better digital products.
Frequently Asked Questions (FAQ)
-
Q: What is the biggest product analytics anti-pattern?
A: Tracking everything without a clear strategy. Without prioritizing meaningful metrics, data becomes noise and leads to poor decisions. -
Q: How can teams align on the right metrics?
A: Create a shared metric dictionary and hold cross-functional KPI alignment sessions to ensure consistency and clarity. -
Q: Should qualitative data be part of product analytics?
A: Absolutely. It provides context to the numbers and helps uncover the motives behind user behavior. -
Q: What are some examples of vanity metrics?
A: Total downloads, total pageviews, or sign-ups are often vanity metrics unless they’re tied to deeper engagement or value metrics. -
Q: How often should data tracking be audited?
A: Ideally, tracking should be reviewed during every major product update and during quarterly analytics health checks.


